
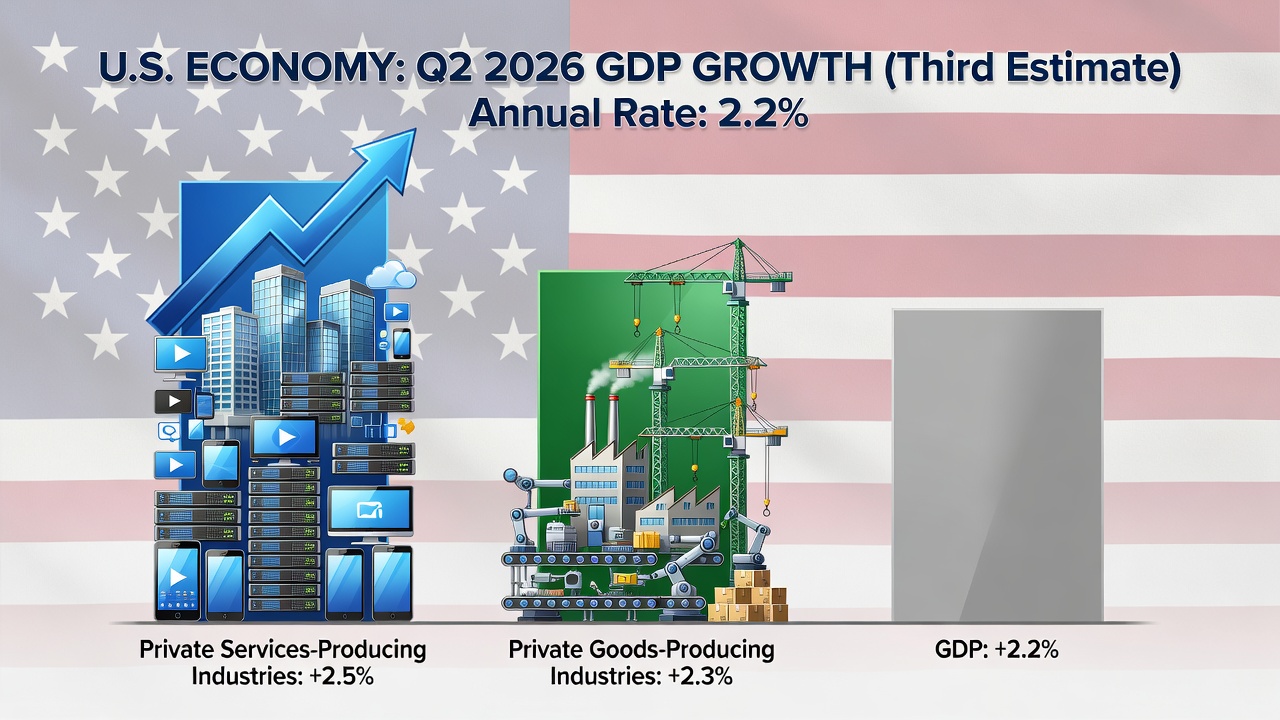
The U.S. economy expanded at an annual rate of 2.2 percent in the second quarter of 2026, according to the third estimate from the Bureau of Economic Analysis. The growth was broad-based across the private sector: real value added rose 2.5 percent for private services-producing industries and 2.3 percent for private goods-producing industries, while government contributed less than 0.1 percent. These figures, released alongside the third GDP estimate each quarter, offer the most detailed industry-level view of where economic momentum is concentrated.
Why Industry Breakdowns Matter
Headline GDP figures tell policymakers and businesses whether the economy grew, but they say little about which sectors did the heavy lifting. The BEA's industry accounts fill that gap by measuring each sector's value added - the difference between what an industry produces and what it consumes as inputs from other industries. The data also break down compensation of employees, gross operating surplus, and taxes on production, giving a fuller picture of how growth translates into wages, business profit, and government revenue.
For businesses operating in digital entertainment, payments, and consumer technology - sectors generally classified within private services-producing industries - this kind of granular data can signal whether broader economic conditions are supportive of discretionary consumer spending. Services industries, which include finance, information technology, and entertainment-adjacent activities, outpaced goods-producing sectors in this quarter's report, suggesting continued resilience in consumer-facing service businesses.
Reading the Numbers in Context
A 2.5 percent increase in services value added and 2.3 percent in goods-producing industries indicates relatively balanced expansion, without one sector dramatically outpacing the other. The government sector's near-flat contribution, at less than 0.1 percent, reflects a pattern common in periods when public-sector output grows slowly relative to private industry, whether due to budget constraints, staffing levels, or the nature of government services themselves, which are harder to measure in output terms than private production.
It is useful to remember that GDP by industry statistics are not released with every GDP estimate. The BEA publishes this detail only with the third and final estimate of each quarter, after more complete source data becomes available. That lag means analysts and businesses often wait weeks beyond the initial GDP headline before they can assess which specific industries actually drove growth or lagged behind.
Implications for Consumer-Facing Sectors
Steady growth in private services-producing industries tends to correlate with healthier consumer spending capacity, which matters for any business reliant on discretionary income, including digital entertainment, media subscriptions, and consumer technology platforms. When service-sector value added grows faster than goods production, it often reflects strength in areas like finance, professional services, and information industries rather than manufacturing or construction.
For companies and regulators tracking economic conditions as part of broader market or compliance planning, these figures serve as a macroeconomic backdrop rather than a direct indicator of any single industry's performance. Value-added data at this level of aggregation cannot isolate the fortunes of narrower subsectors, but it does confirm that the broader growth environment in the second quarter of 2026 was neither goods-led nor service-led in an extreme sense - both private categories expanded at comparable rates, with government growth essentially flat.